How to visualize the output result of each parameter in PIC-PLASMA 3D
How to graph analysis data from PIC-PLASMA 3D (lite Edition/pro Edition)
The analysis data in PIC-PLASMA 3D is output in 3D.
The following three parameters can be visualized within the software.
Electron density
Ion density
Gas density (pro version only)
In addition to the above three parameters, this software can output the following parameters.
ポイント
H: Magnetic field strength [A/m]
B: Magnetic flux density [T]
M: Magnetization [A/m]
NodeVol: Node volume [m³]
ef: Electric field [V/m]
j.e-: Electron current density [A/m²]
j.ion: Ion current density [A/m²]
j.neutral: Neutral particle flux density [kg/(m²·s)]
object_id: Object ID (Objects with assigned potential are output as 1.)
phi: Potential [V]
phi_m: Magnetic potential [A/m]
phi_m_theory: Theoretical magnetic potential [A/m]
rho: Density [kg/m³]
vel.e-: Electron velocity [m/s]
vel.ion: Ion velocity [m/s]
vel.neutral: Neutral particle velocity [m/s]
The output analysis results can be visualized using Paraview.
Visualization methods in Paraview
You can visualize each parameter by dragging the vti format into Paraview.
The method for importing analysis results into Paraview is shown below.
Launch ParaView.
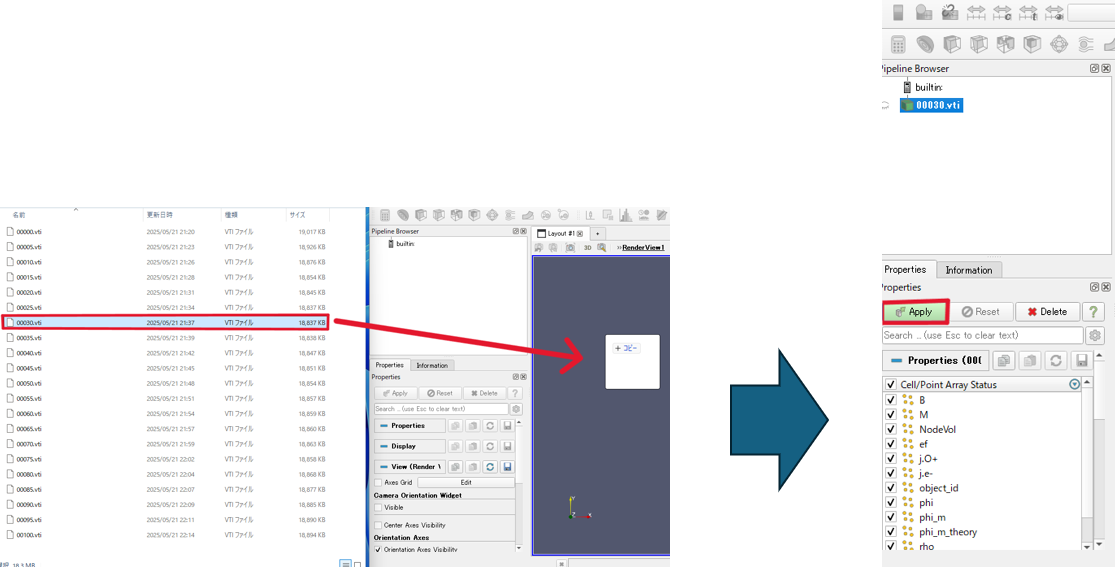
With ParaView running, open the folder containing the calculation results output by the “calculate” function of PIC-PLASMA 3D.The “vti” folder contains calculation results for different time steps saved in “.vti” format. Select the “.vti” file corresponding to the data for the time you want to analyze, hold down the left mouse button (drag operation), and move it directly to the ParaView window that is running.Once you have moved it to the desired location, release the mouse button to drop the file, which will then be loaded.
Select the Apply button.
Methods for visualizing each physical quantity
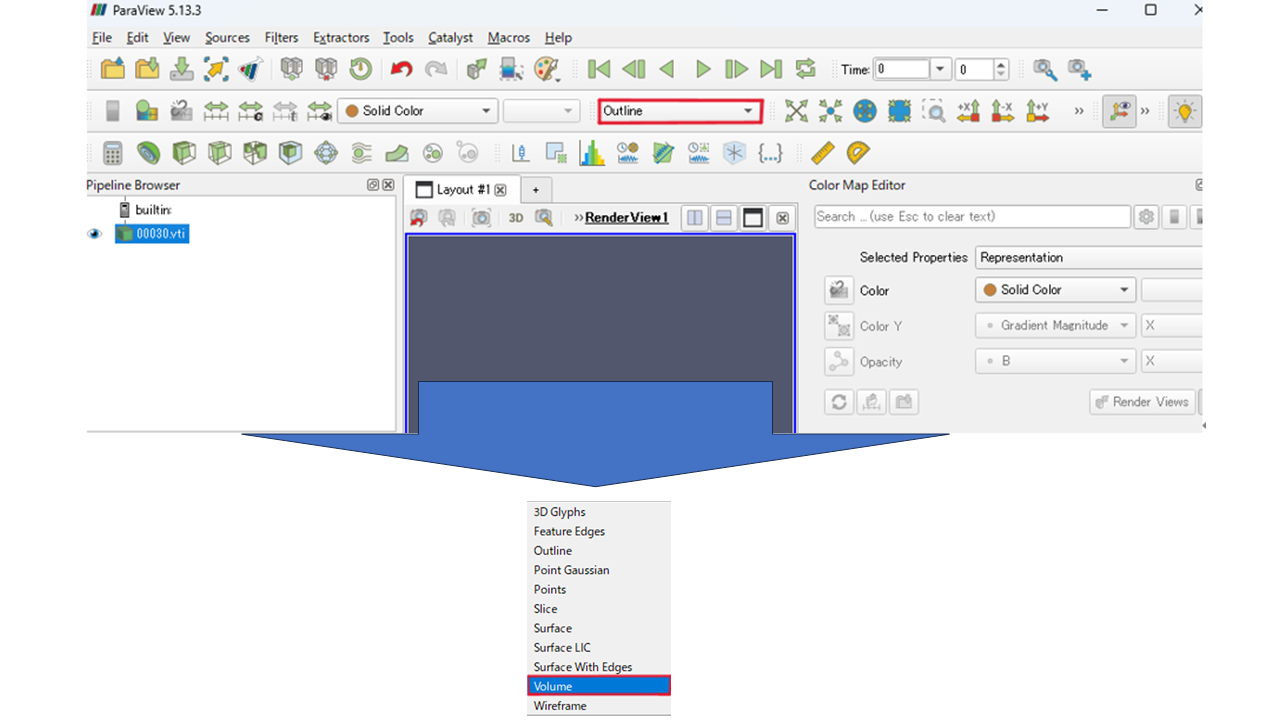
When displaying a loaded .vti file in ParaView, you can select which physical quantities to visualize by selecting an item from the Solid Color drop-down menu at the top of the screen or in the properties panel.
If you want to make spaces with no values (0) transparent for the selected physical quantity, select Volume. If you want to display spaces with no values (0) as well, use Surface, Points, etc.
We also recommend adjusting the settings to make analysis easier for each user.
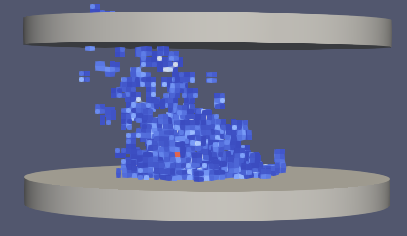
The scalar values (magnitude) of each physical quantity are displayed in color, allowing you to confirm their spatial distribution.
Doctor
By importing stl files as shown in the figure below, you can get a clearer picture of the particle distribution in space!