The following are the analysis results for the ion extraction process of the plasma ion source in this tutorial.
Let's try creating a simulation like the one in the video using the tutorial as a reference.
Note that this analysis requires PIC.msi and plasmaion.obj. (Click to download each file.)
Execution of analysis
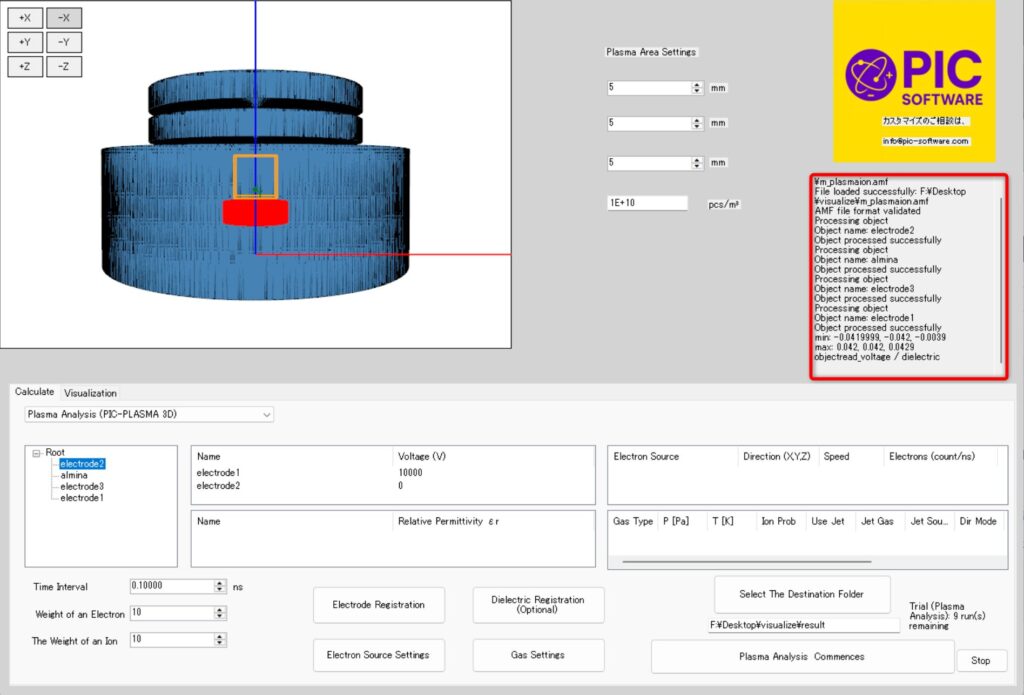
①Drag and drop the plasmaion.obj(3D file).
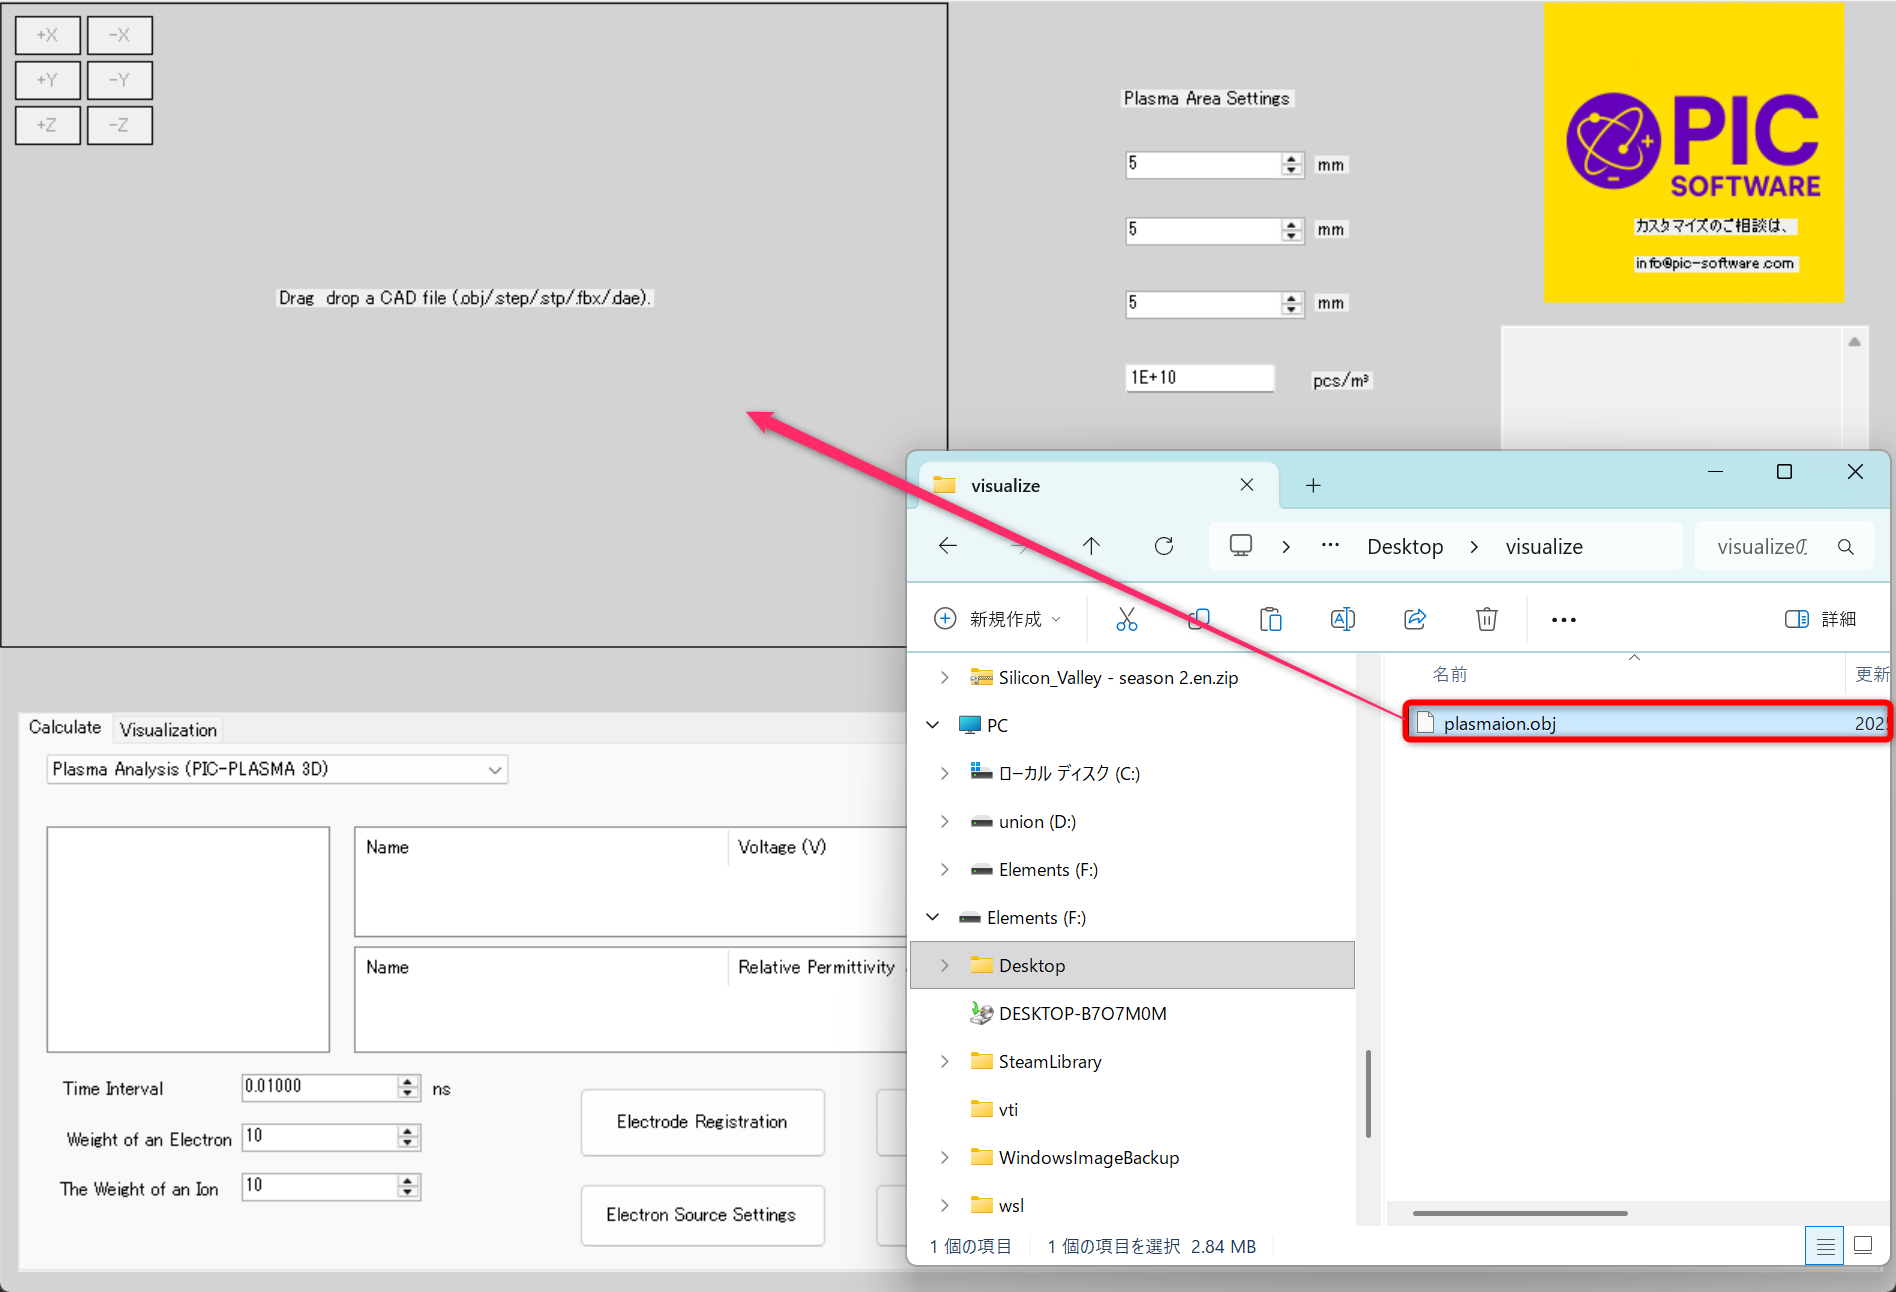
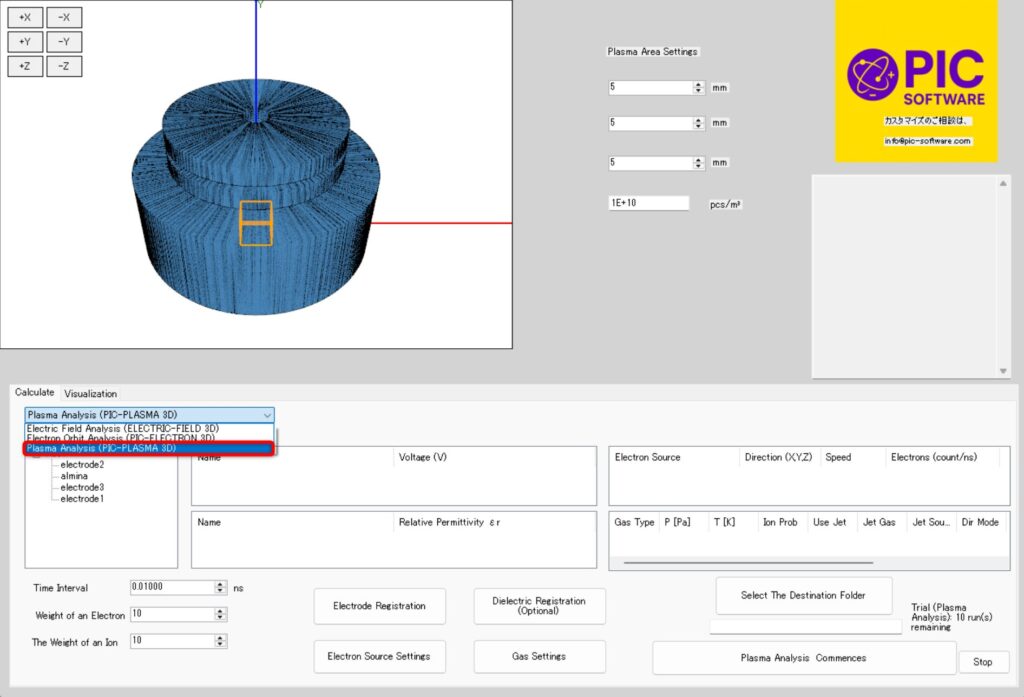
② When dropped, the plasma ion source will appear on the screen.
From the dropdown menu under the Calculate tab (Electric Field Analysis, Electron Orbit Analysis, Plasma Analysis), select ‘Plasma Analysis’.
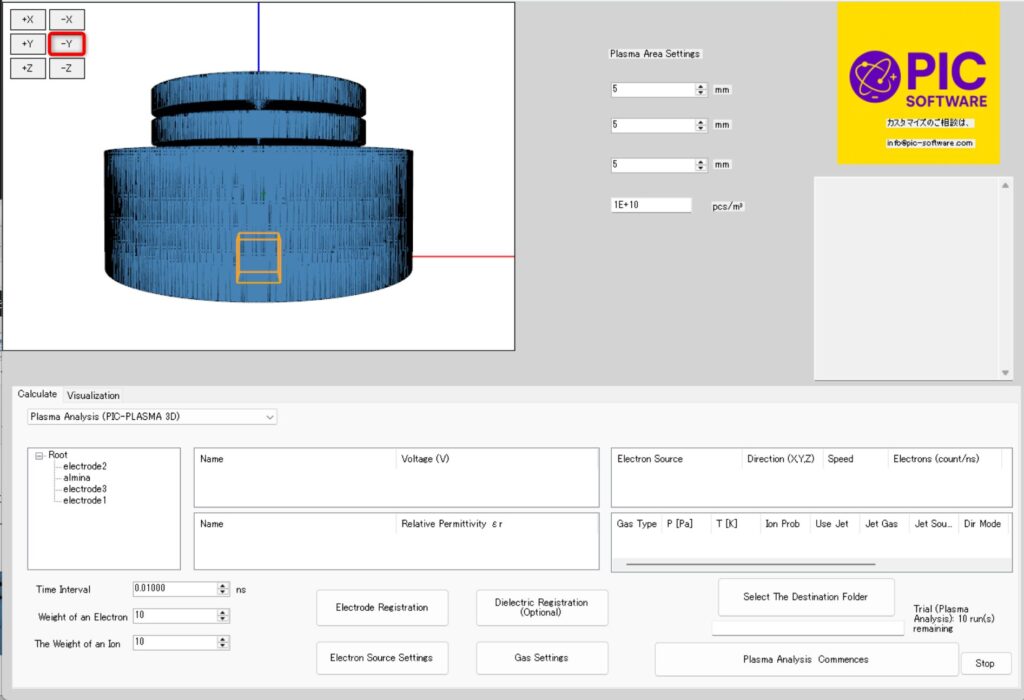
③ Click ‘-Y’ to change the view to the perspective from the Y-axis.
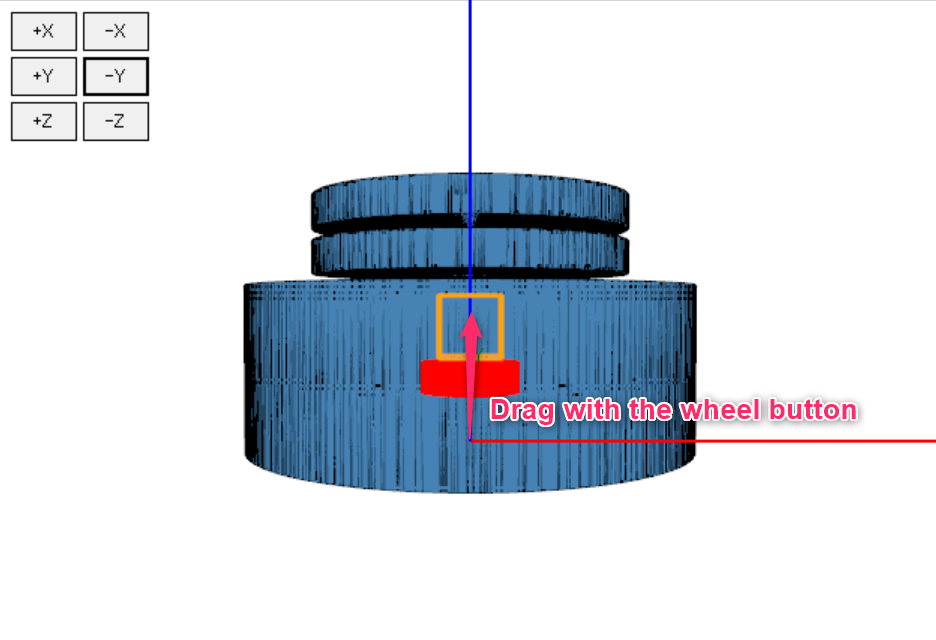
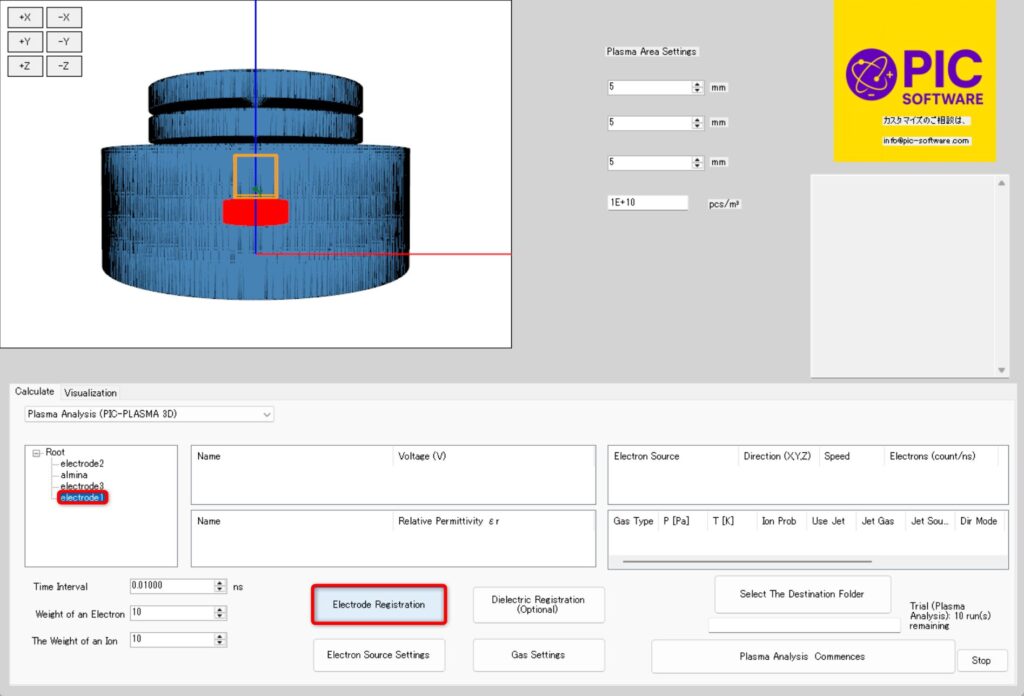
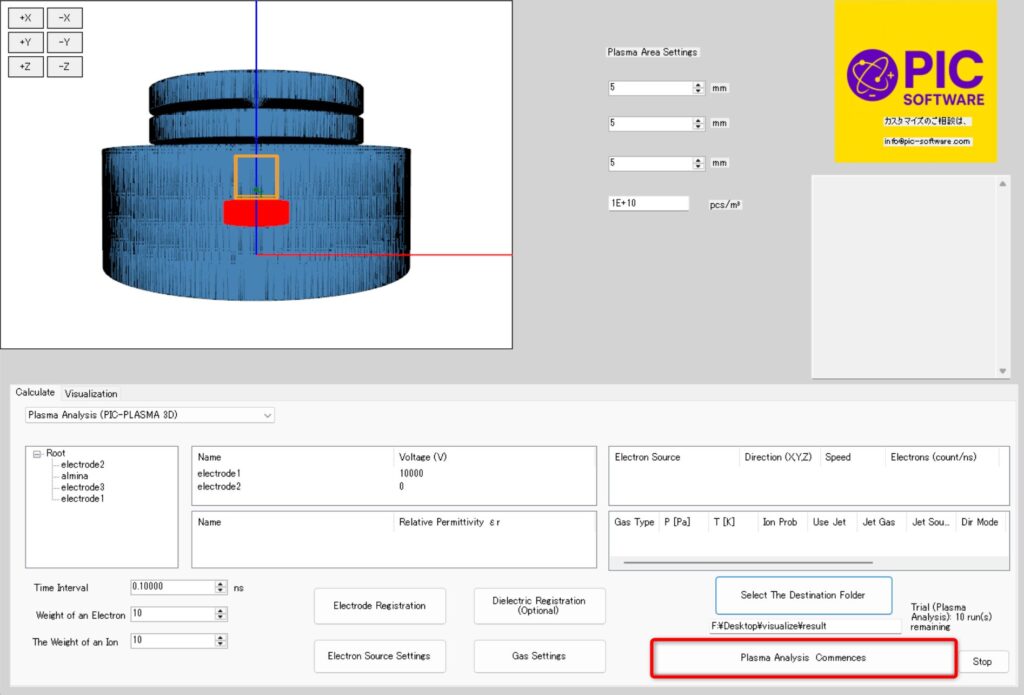
④ Use the mouse wheel button to position the plasma area over electrode1 (shown in red in the figure below).
During analysis, you can generate plasma at a constant density within the yellow rectangular area.
⑤ Select the part to which you want to add an electrode > Click Register Electrode > Enter the voltage value > Click OK.

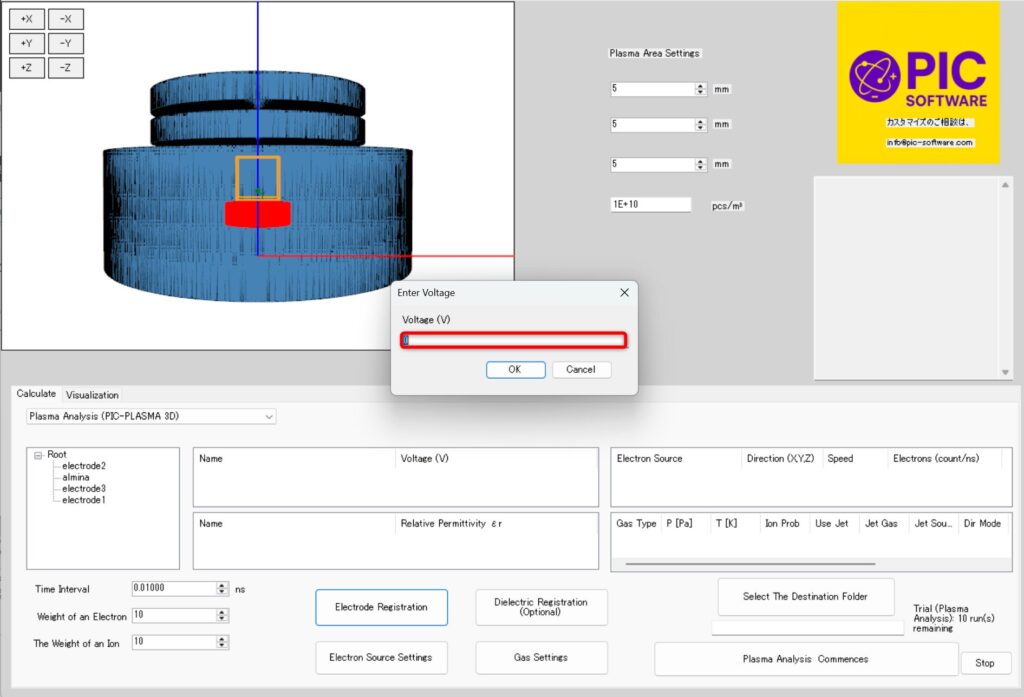
⑥ This time, set electrode1 to ‘10000V’ and electrode2 to ‘0V’.
The set voltage values will be output in a list. (If you enter a value incorrectly, you can delete it using the delete key.)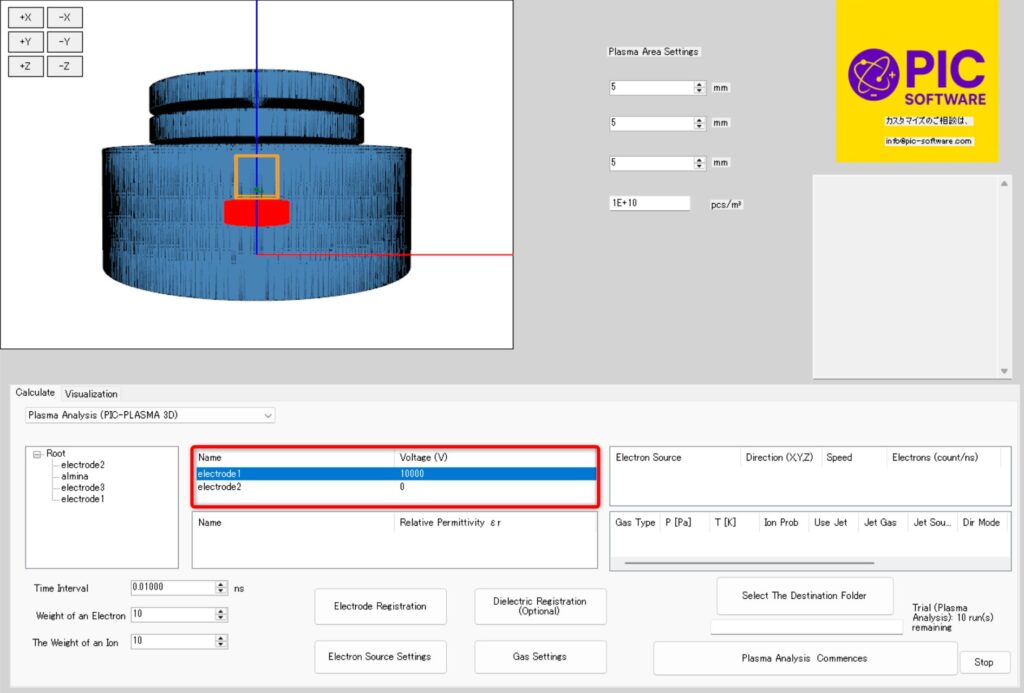
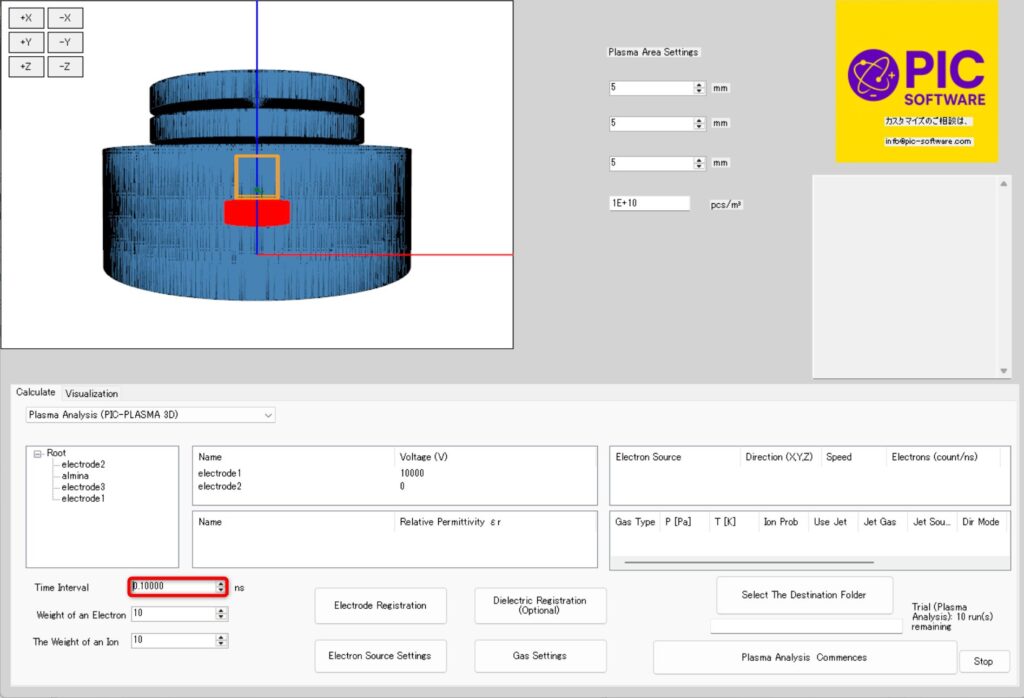
⑦ Next, set the time interval. The time interval refers to the fineness of the time divisions used for calculation. (Note: This software performs a total of 2000 calculations.)
For this calculation, set the time interval to ‘0.1ns’.
⑧ Select a save folder. (Since files are output during calculations, we recommend saving them in a new folder.)
Be sure to select a folder on a drive with sufficient free space.
⑨That completes the analysis settings. (Thank you for your hard work.)
Click the ‘Start Plasma Analysis’ button to begin the analysis.
⑩ The following log will be output.
Please wait until execution completes (takes several tens of minutes).
⑪When the execution is complete, the message “Execution completed” will be displayed.
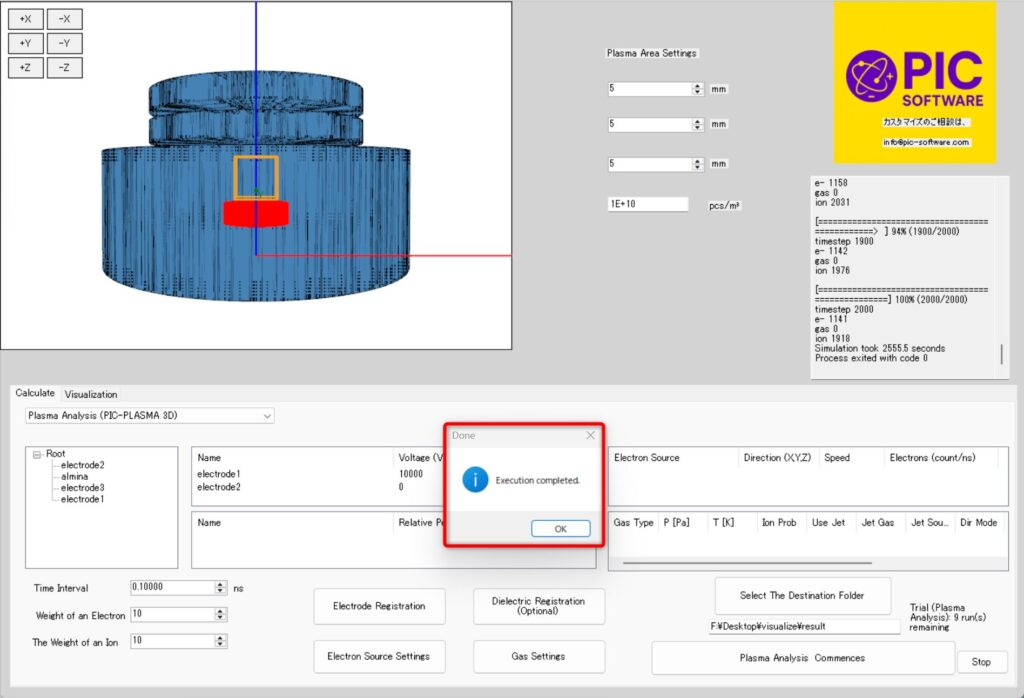
This concludes the calculation.
Visualization
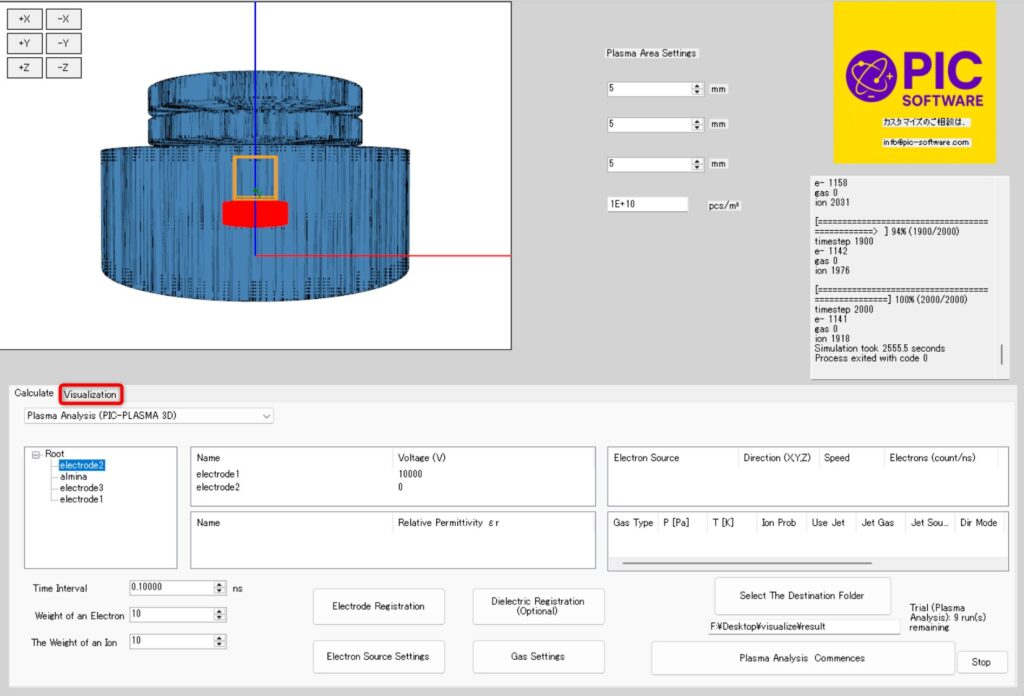
① Now, let's visualize the calculated results.
Click the ‘Visualization’ tab in the figure below.
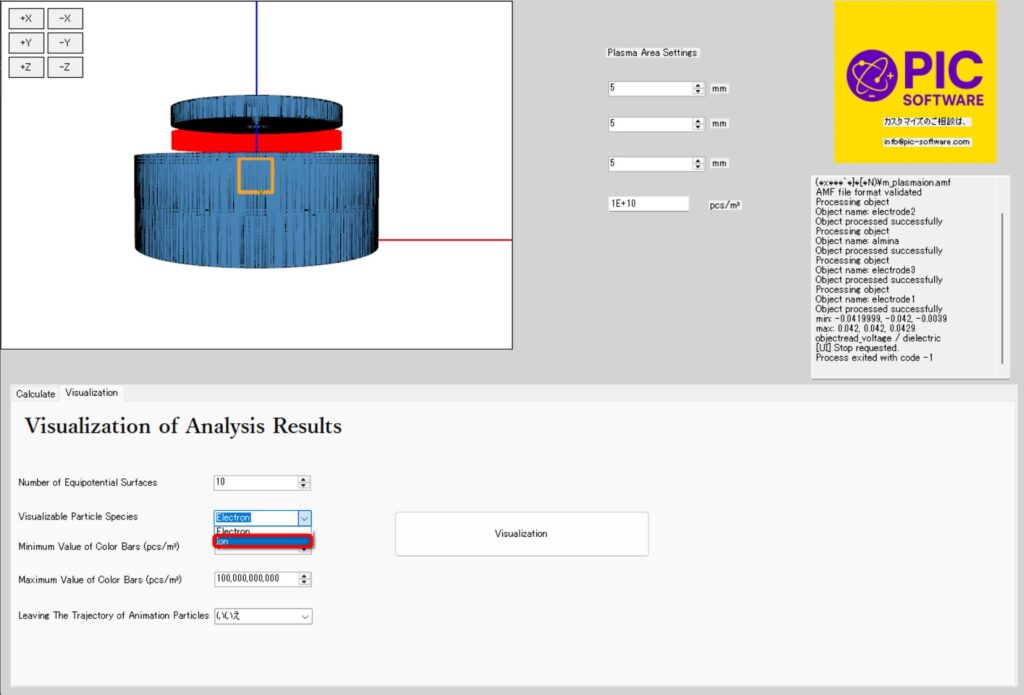
②This time, we will visualize the ion extraction process in the plasma ion source.
Therefore, we will change the particles to be visualized from electrons to ions.
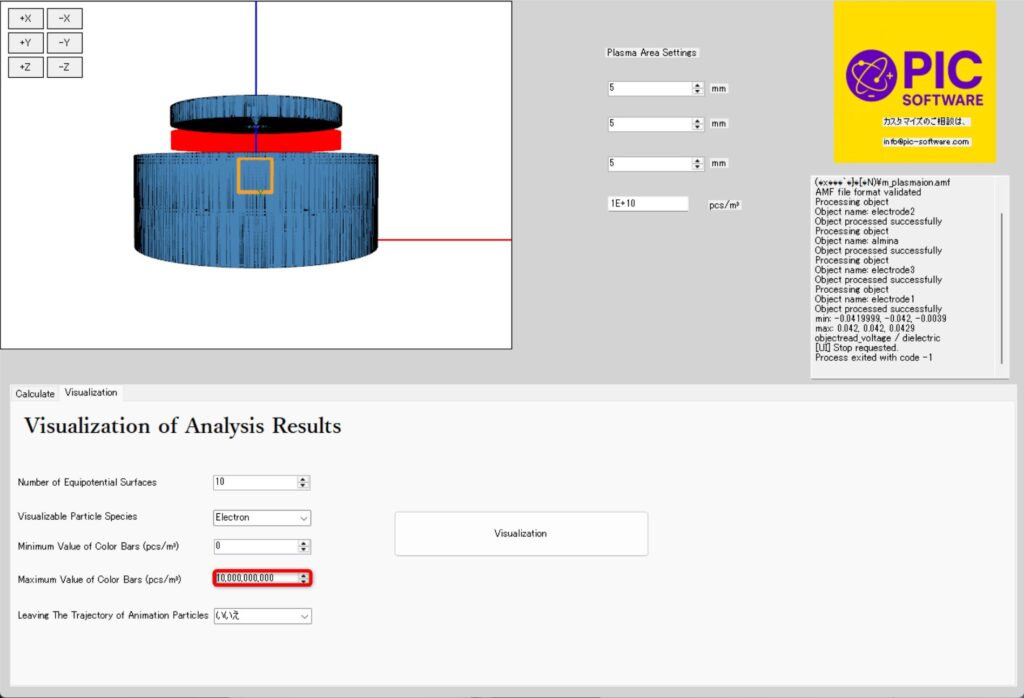
③ Change the maximum value of the color bar from ‘100,000,000,000’ to ‘10,000,000,000’.
Setting it as above makes areas with low particle density easier to see.
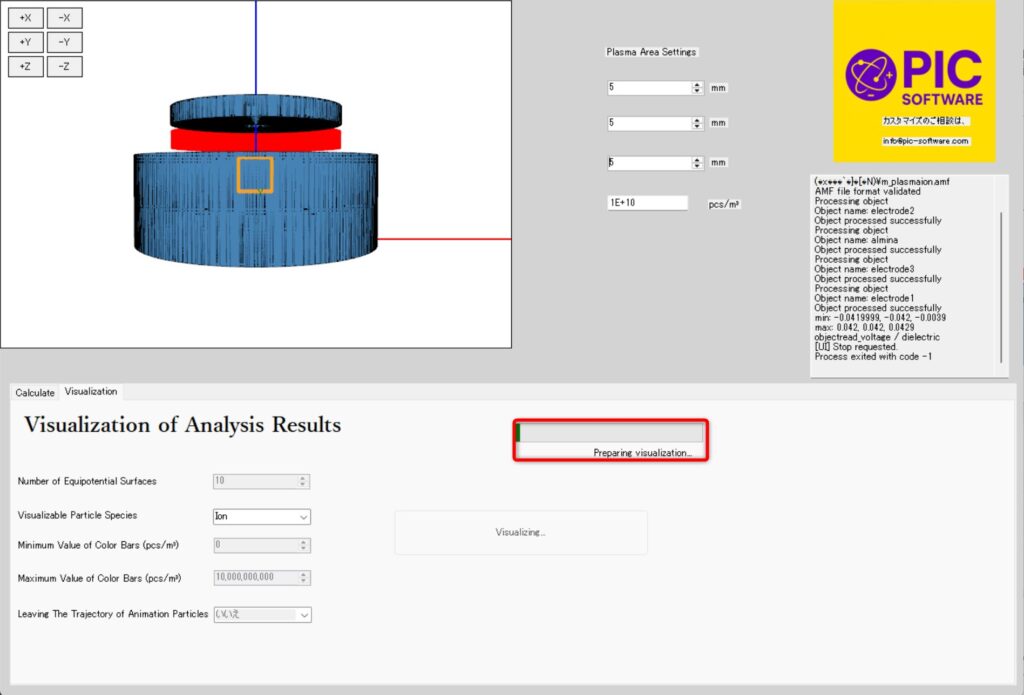
④ Click the Visualization button to start visualization. (Visualization may take several tens of seconds.)
⑤ A separate window will display a screen like the one below. Click the three blue buttons to hide the electric field and potential lines. (This makes the particle data easier to see.)
The opaque areas displayed in blue and red (blue box in the figure below) represent ions within the plasma. (Note: You can also visualize electrons by selecting them in the settings screen.)
⑥Press Enter to refresh the frame. (Due to the large file size, loading may take a moment.)
After pressing Enter 20 times, close the window.
The video will be saved to the destination file. (Below).
This completes the visualization of the ion extraction process in the plasma ion source.
Thank you for your hard work.
After completing the tutorial, try loading any 3D CAD file and experiment with various analyses.
You can also try analyses not covered this time, such as electron orbital analysis and analyses using dielectrics.